Working with LMS analytics doesn’t have to be intimidating. You can power up your decision-making processes with just a few new skills and propel yourself towards success.
I’ve worked with analytics for over a decade as a Digital Marketer, and although I’m far from a data scientist, I’ve picked up skills that help me use data to reach my goals some of which I’m sharing with you in this article.
Why LMS Analytics Matter

Analytics help you make better-informed decisions.
Picture this: you’ve just launched a cutting-edge learning platform. Now, the crucial step is to drive user engagement and ensure your learning materials are being used.
Here’s the scenario: you could rely on anecdotes and intuition to gauge progress. When asked about your platform’s performance, you might shrug and say, ‘Seems to be going well.”
But hold on.
There’s a better way: leveraging analytics to unearth insights.
Beyond progress reports, LMS analytics serve as your compass, guiding you towards enhanced engagement levels, identifying potential hurdles, and providing invaluable insights to craft a thriving LMS.
Later in this article, I’ll delve into specific examples of the insights you can glean and practical methods to apply this data. But, before diving into its application, you need establish how to capture data.
Enter Analytics: Seamlessly Integrated
with Your LMS
There are various options to choose from when gathering data, but I’ll focus on Google Analytics, because there are no costs involved and it can work on any web-based platform.
Google Analytics stands as the tool of choice for tracking user behaviour online. With its user-friendly interface, effortless installation, and cost-free accessibility, it emerges as a great option for your learning management system.
It’s worth noting that Google Analytics mainly provides quantitative data. If you aim to dive into the performance of specific individuals — such as the courses they’ve completed—you’ll need to turn to your LMS’s reporting functionality, like those found in Moodle or Totara.
Google Analytics offers a treasure trove of data about user engagement, interaction patterns, and platform utilisation metrics, offering invaluable insights into your LMS’s performance landscape.
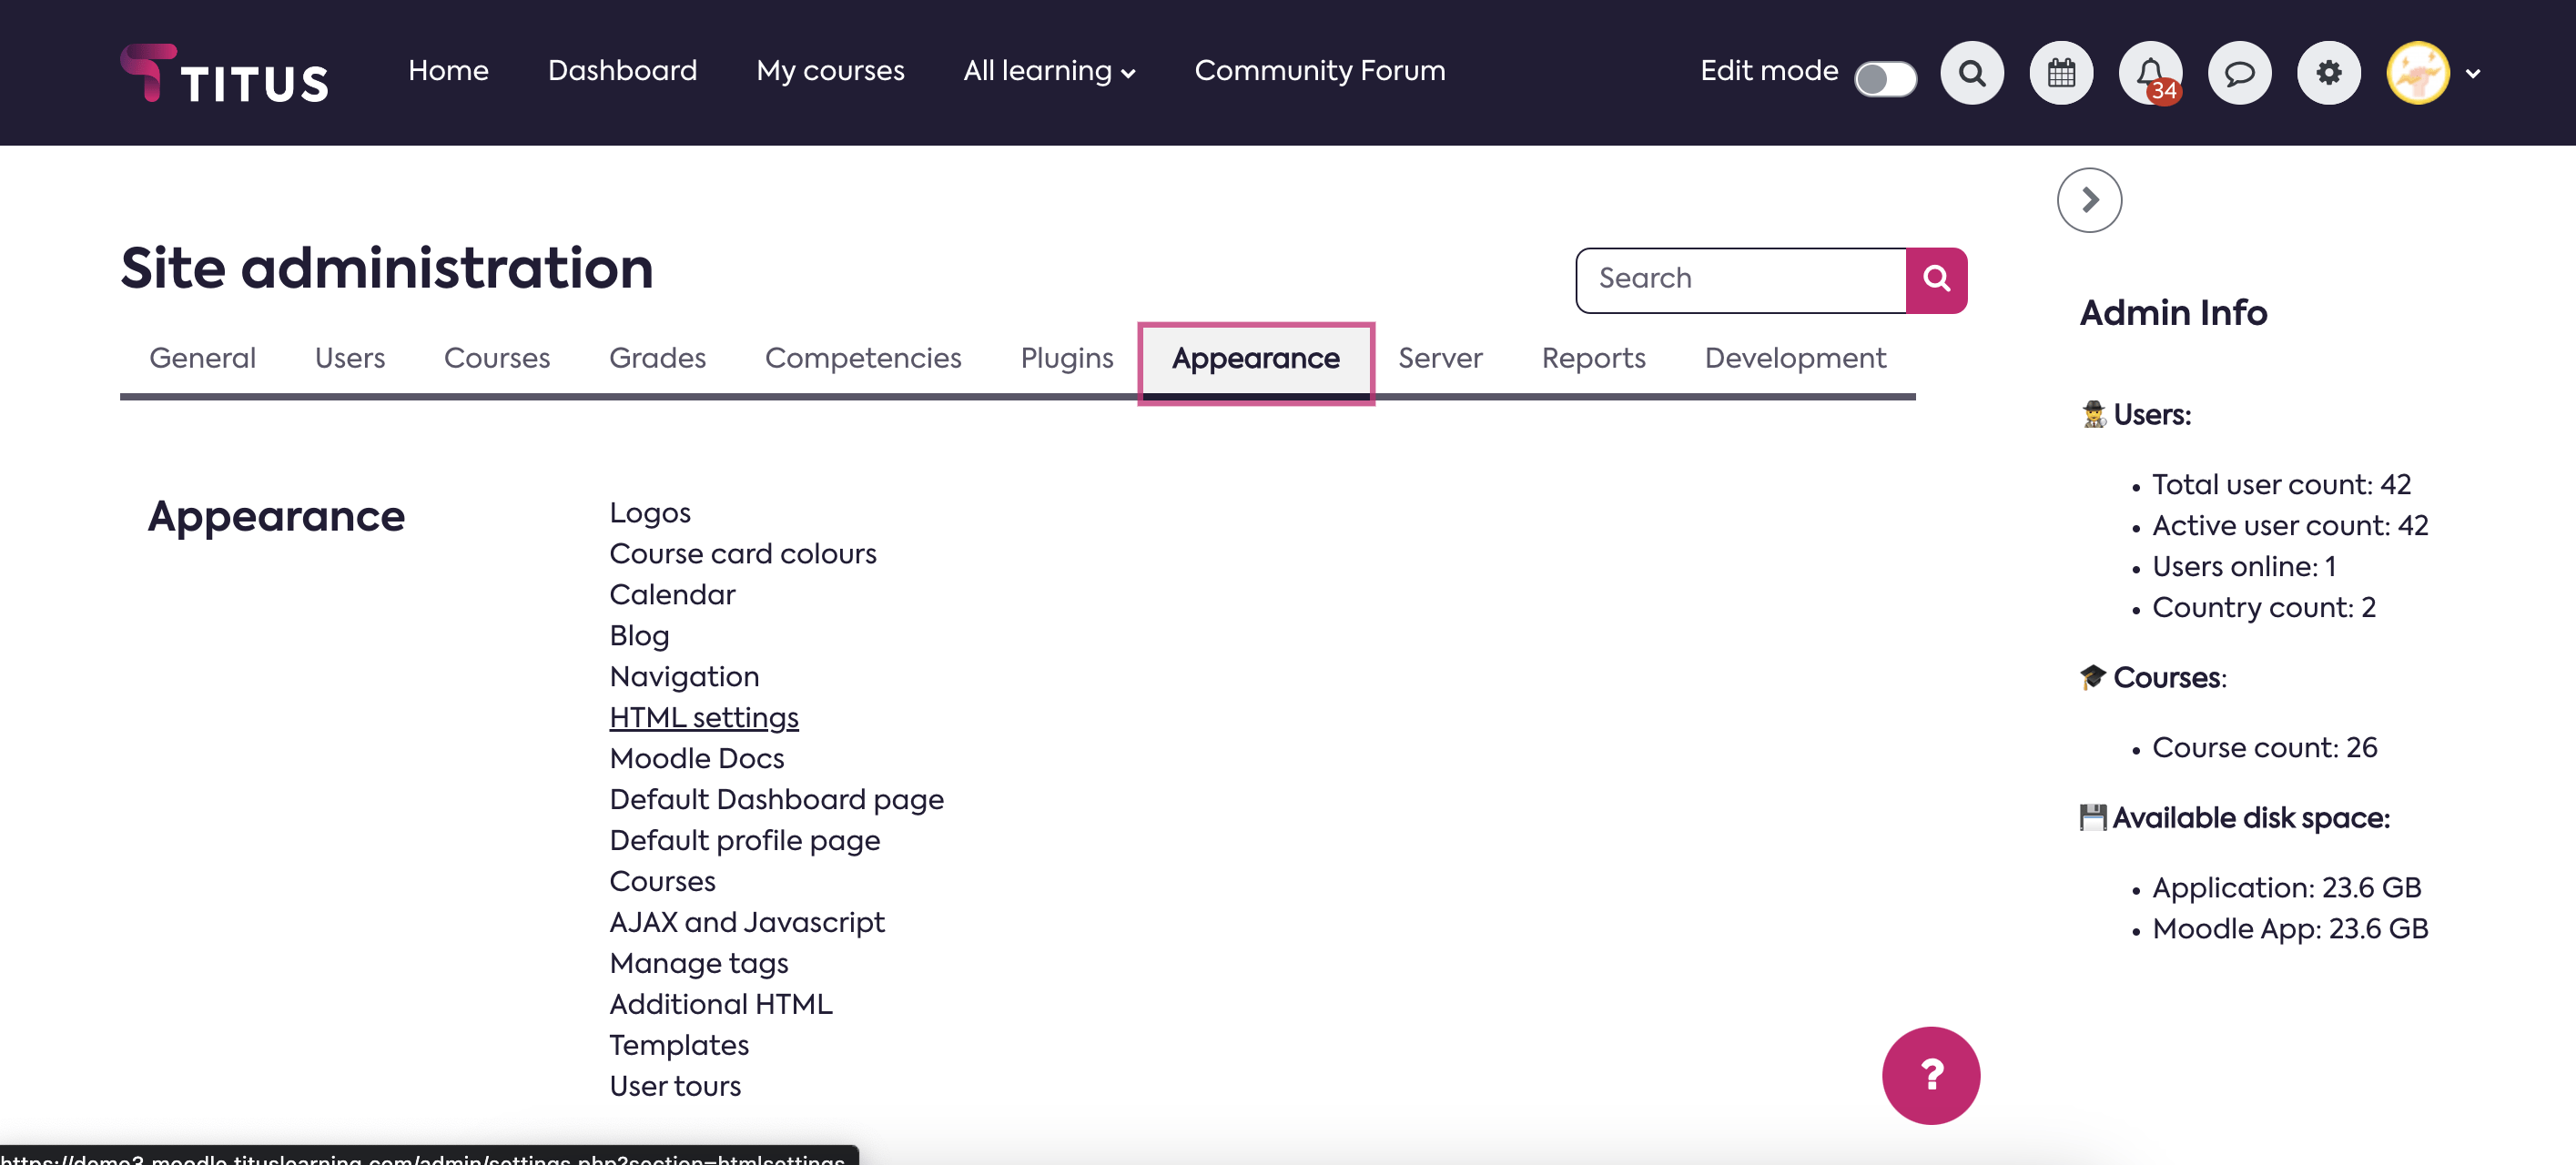
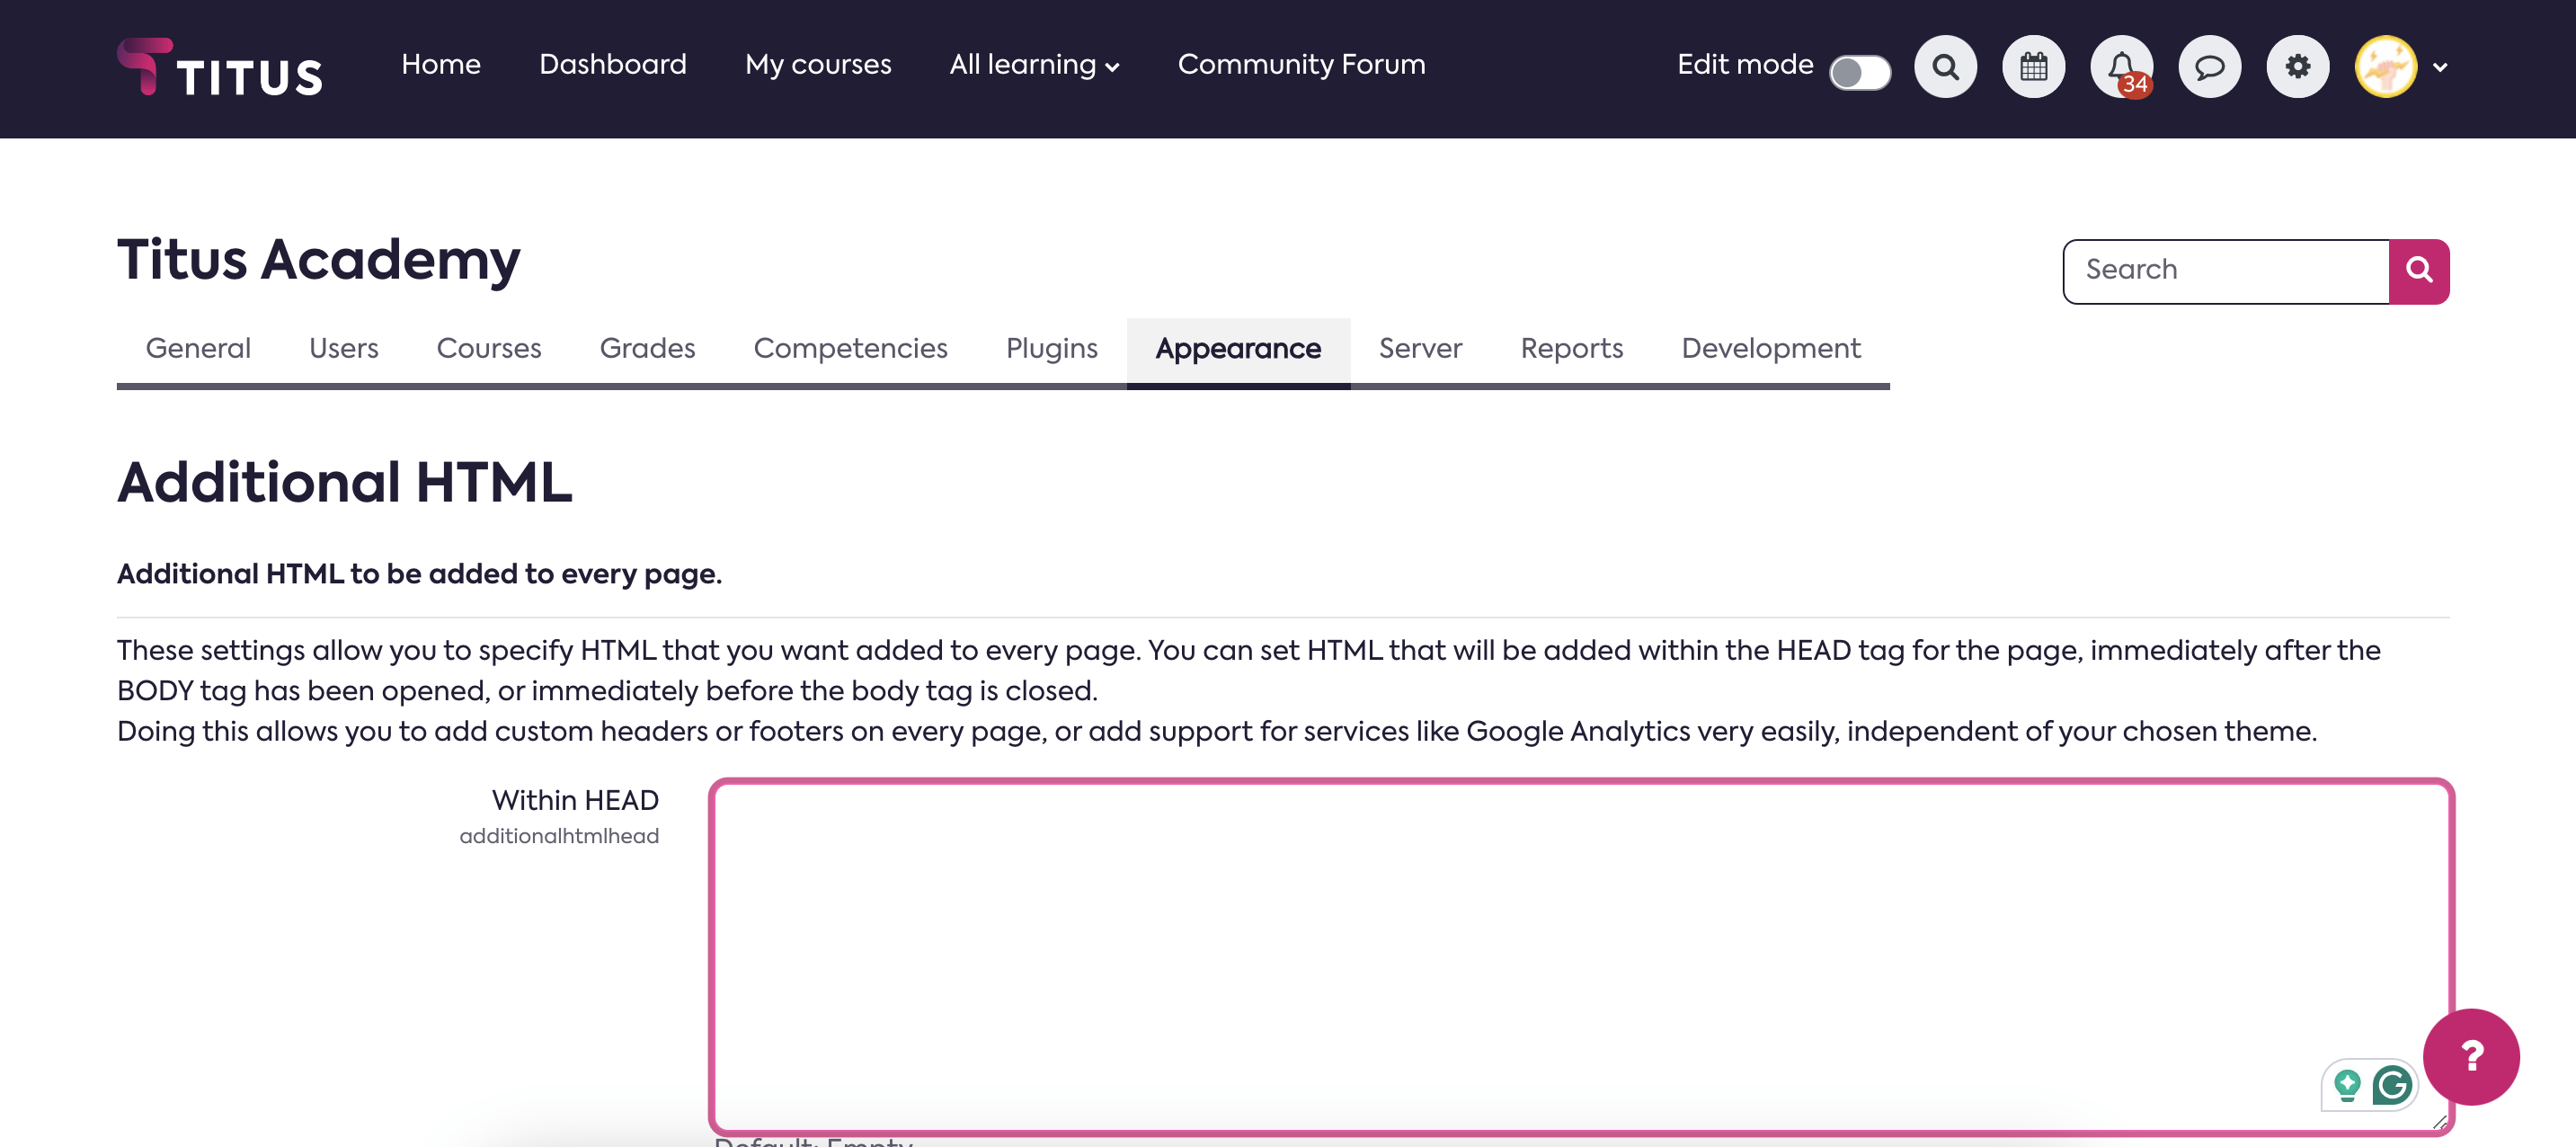
How to install Google Analytics on Moodle
We create Learning Platforms based on either Moodle or Totara, I’ll provide a quick guide on how to install Google Analytics using Moodle as an example, but the steps should be similar for other systems.
1. Create a Google Account
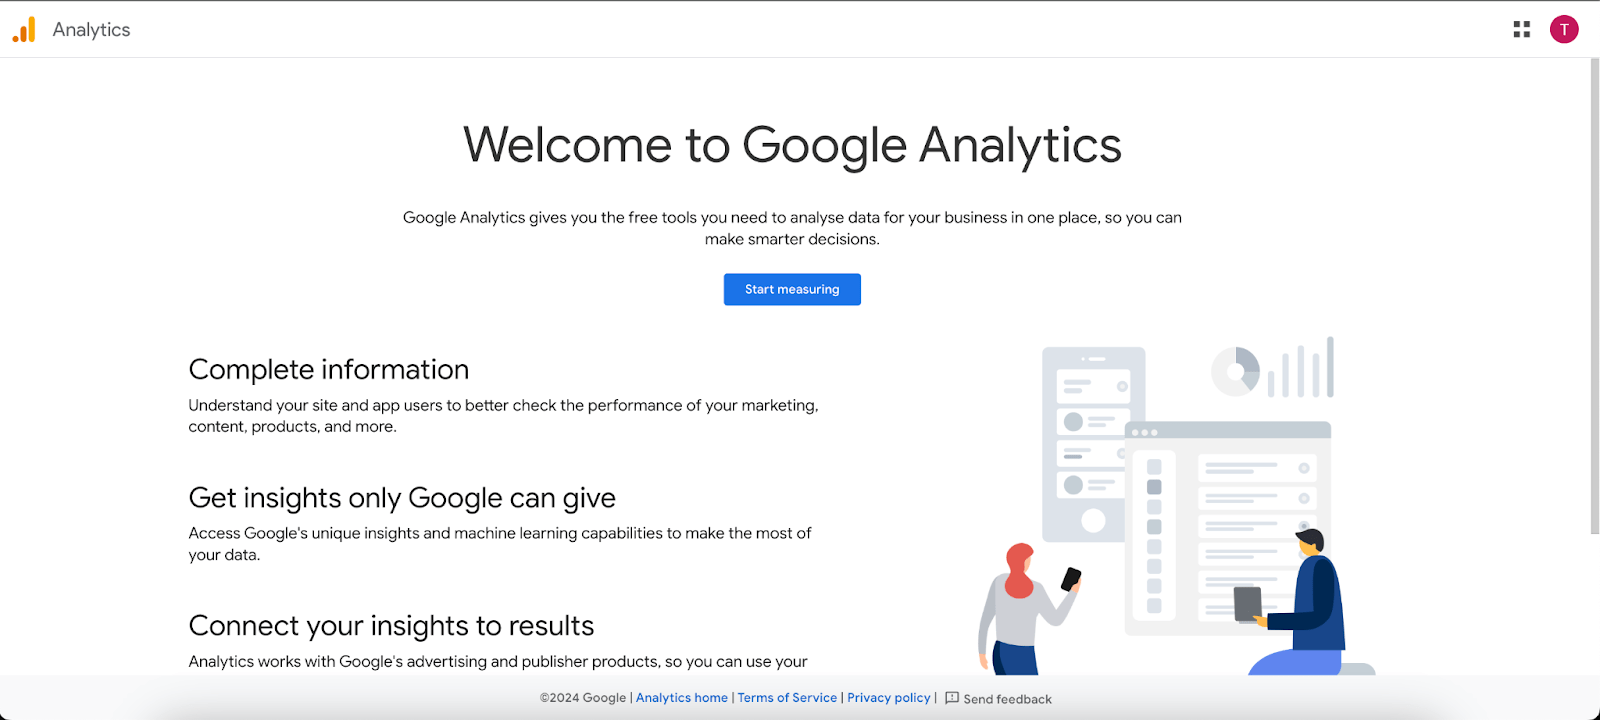
Firstly, if you don’t already have a Google Account, you need to set one up. You can do that for free by visiting this link and following the steps provided. Once you’ve got your account set up, head over to Google Analytics.
Installation Steps


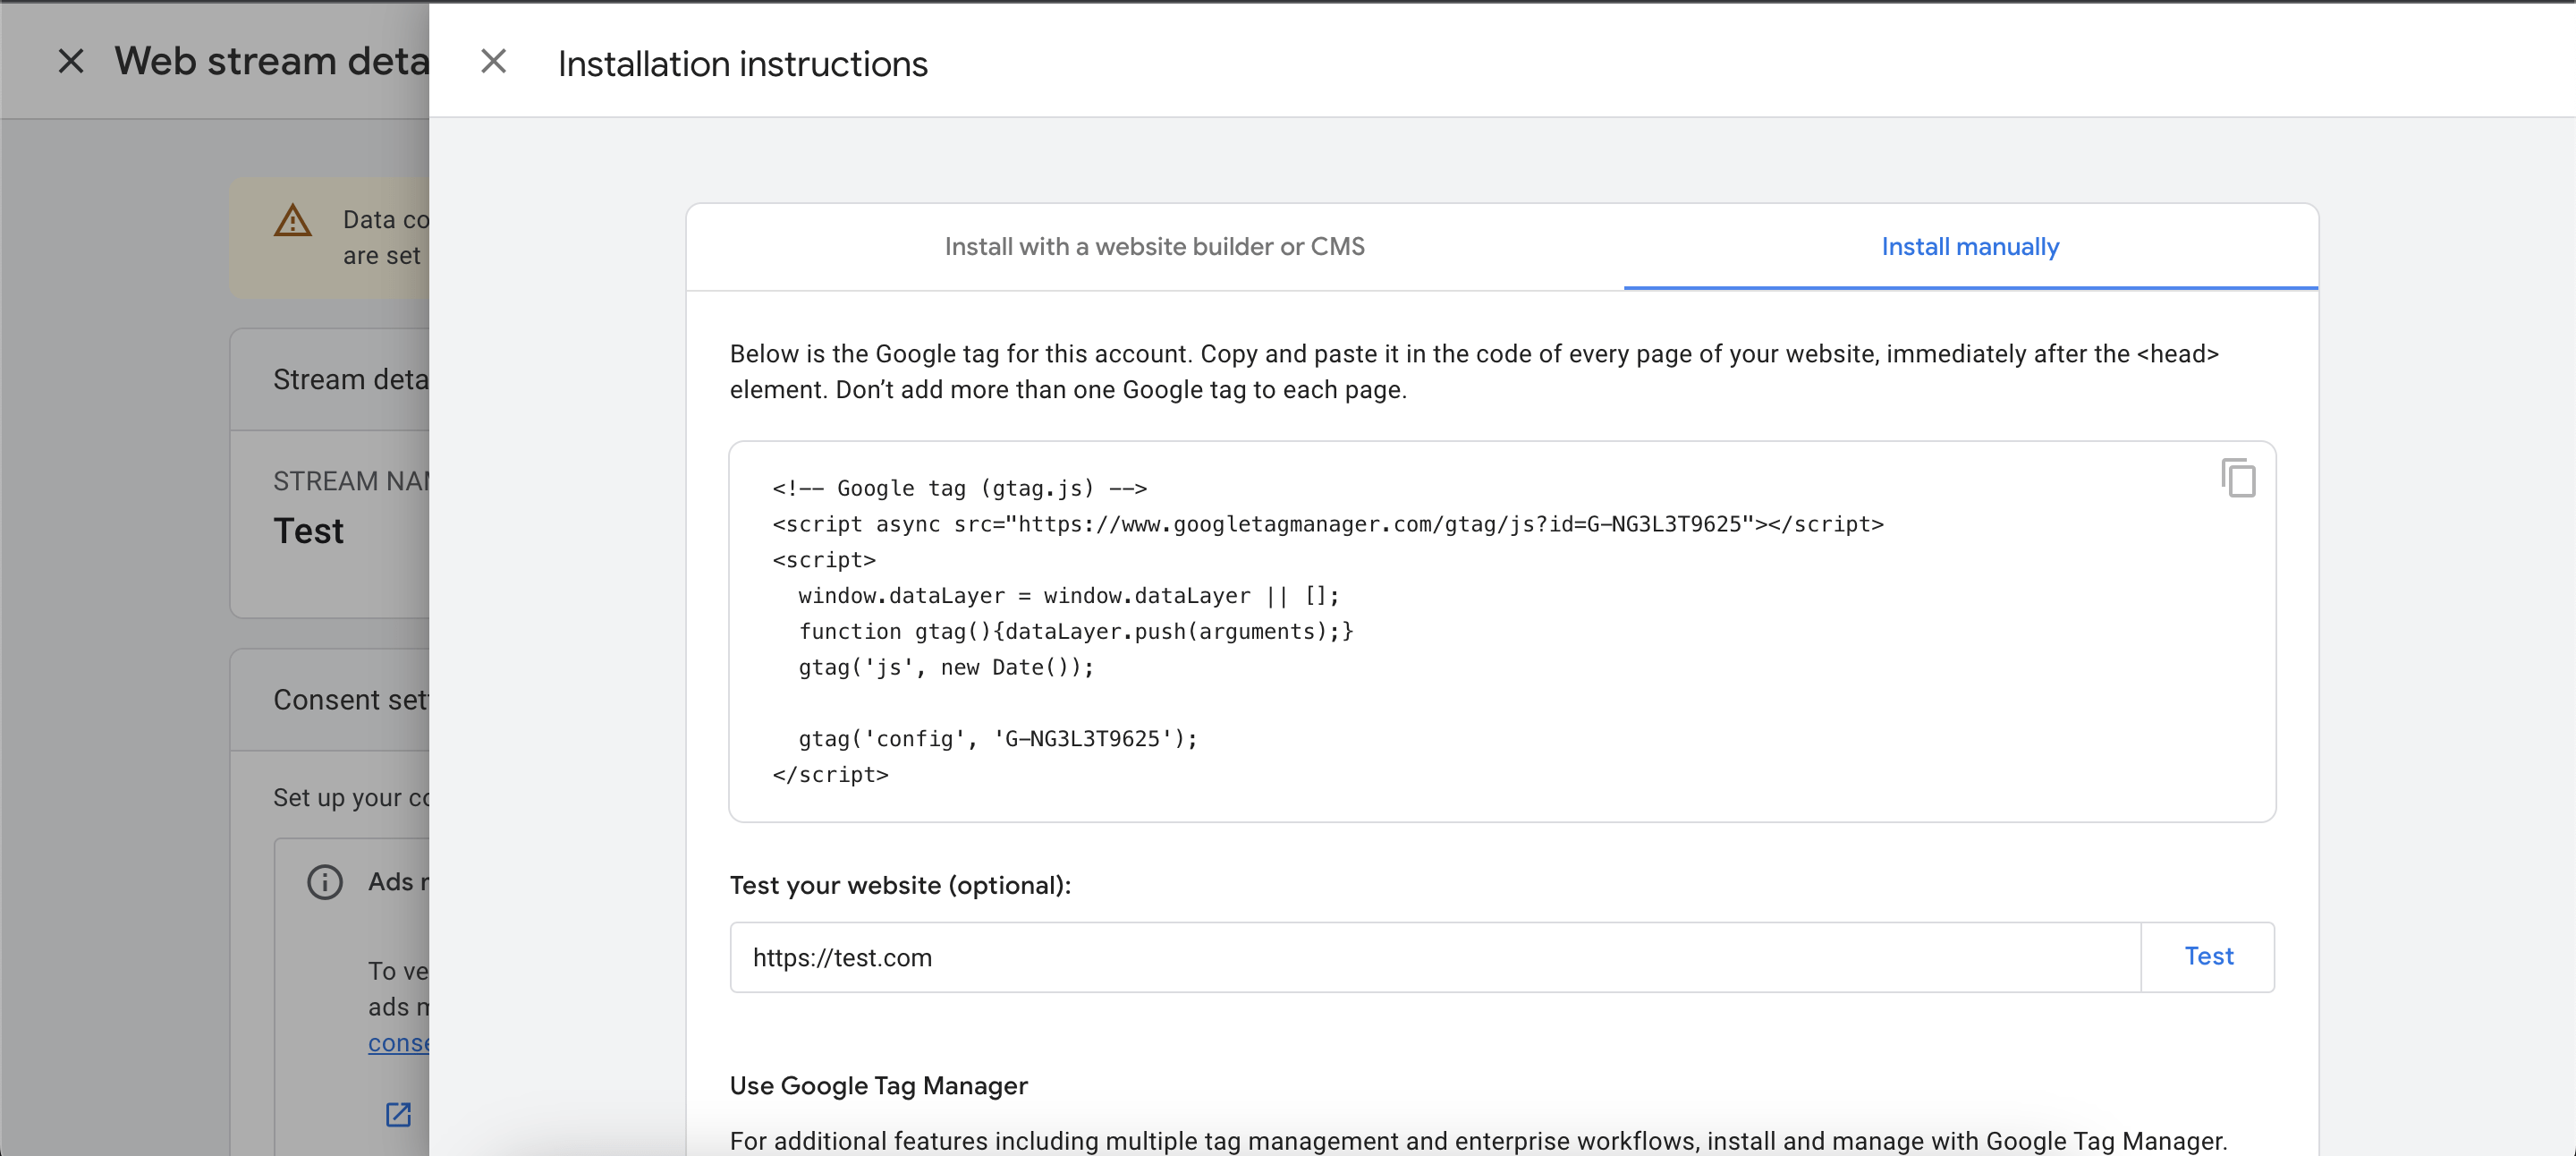
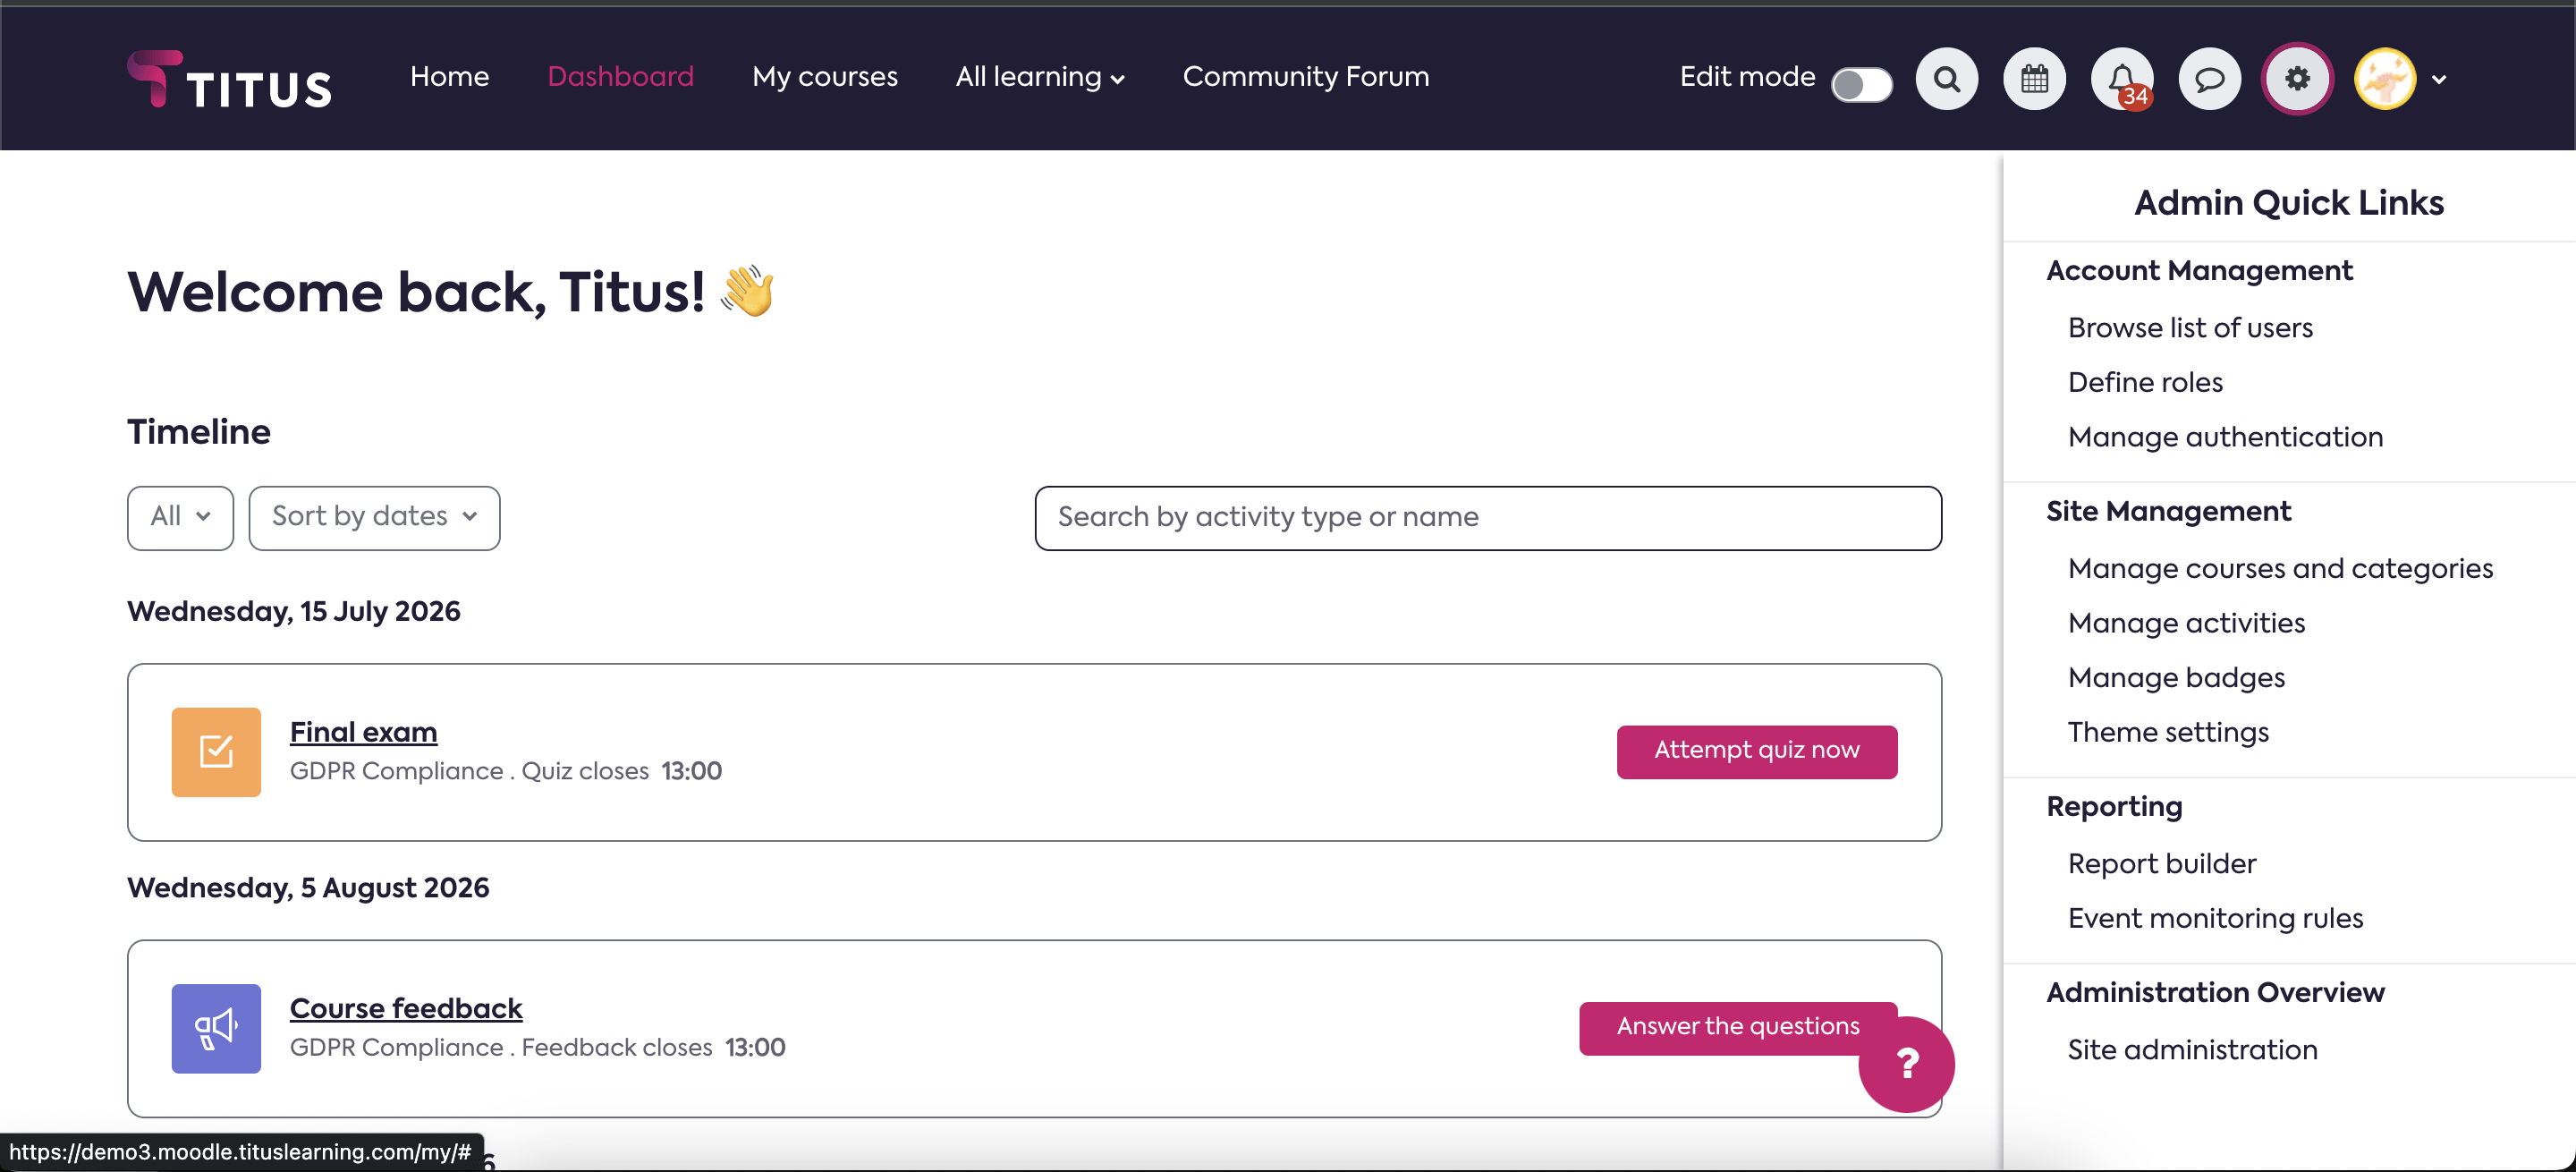
The dashboard explained
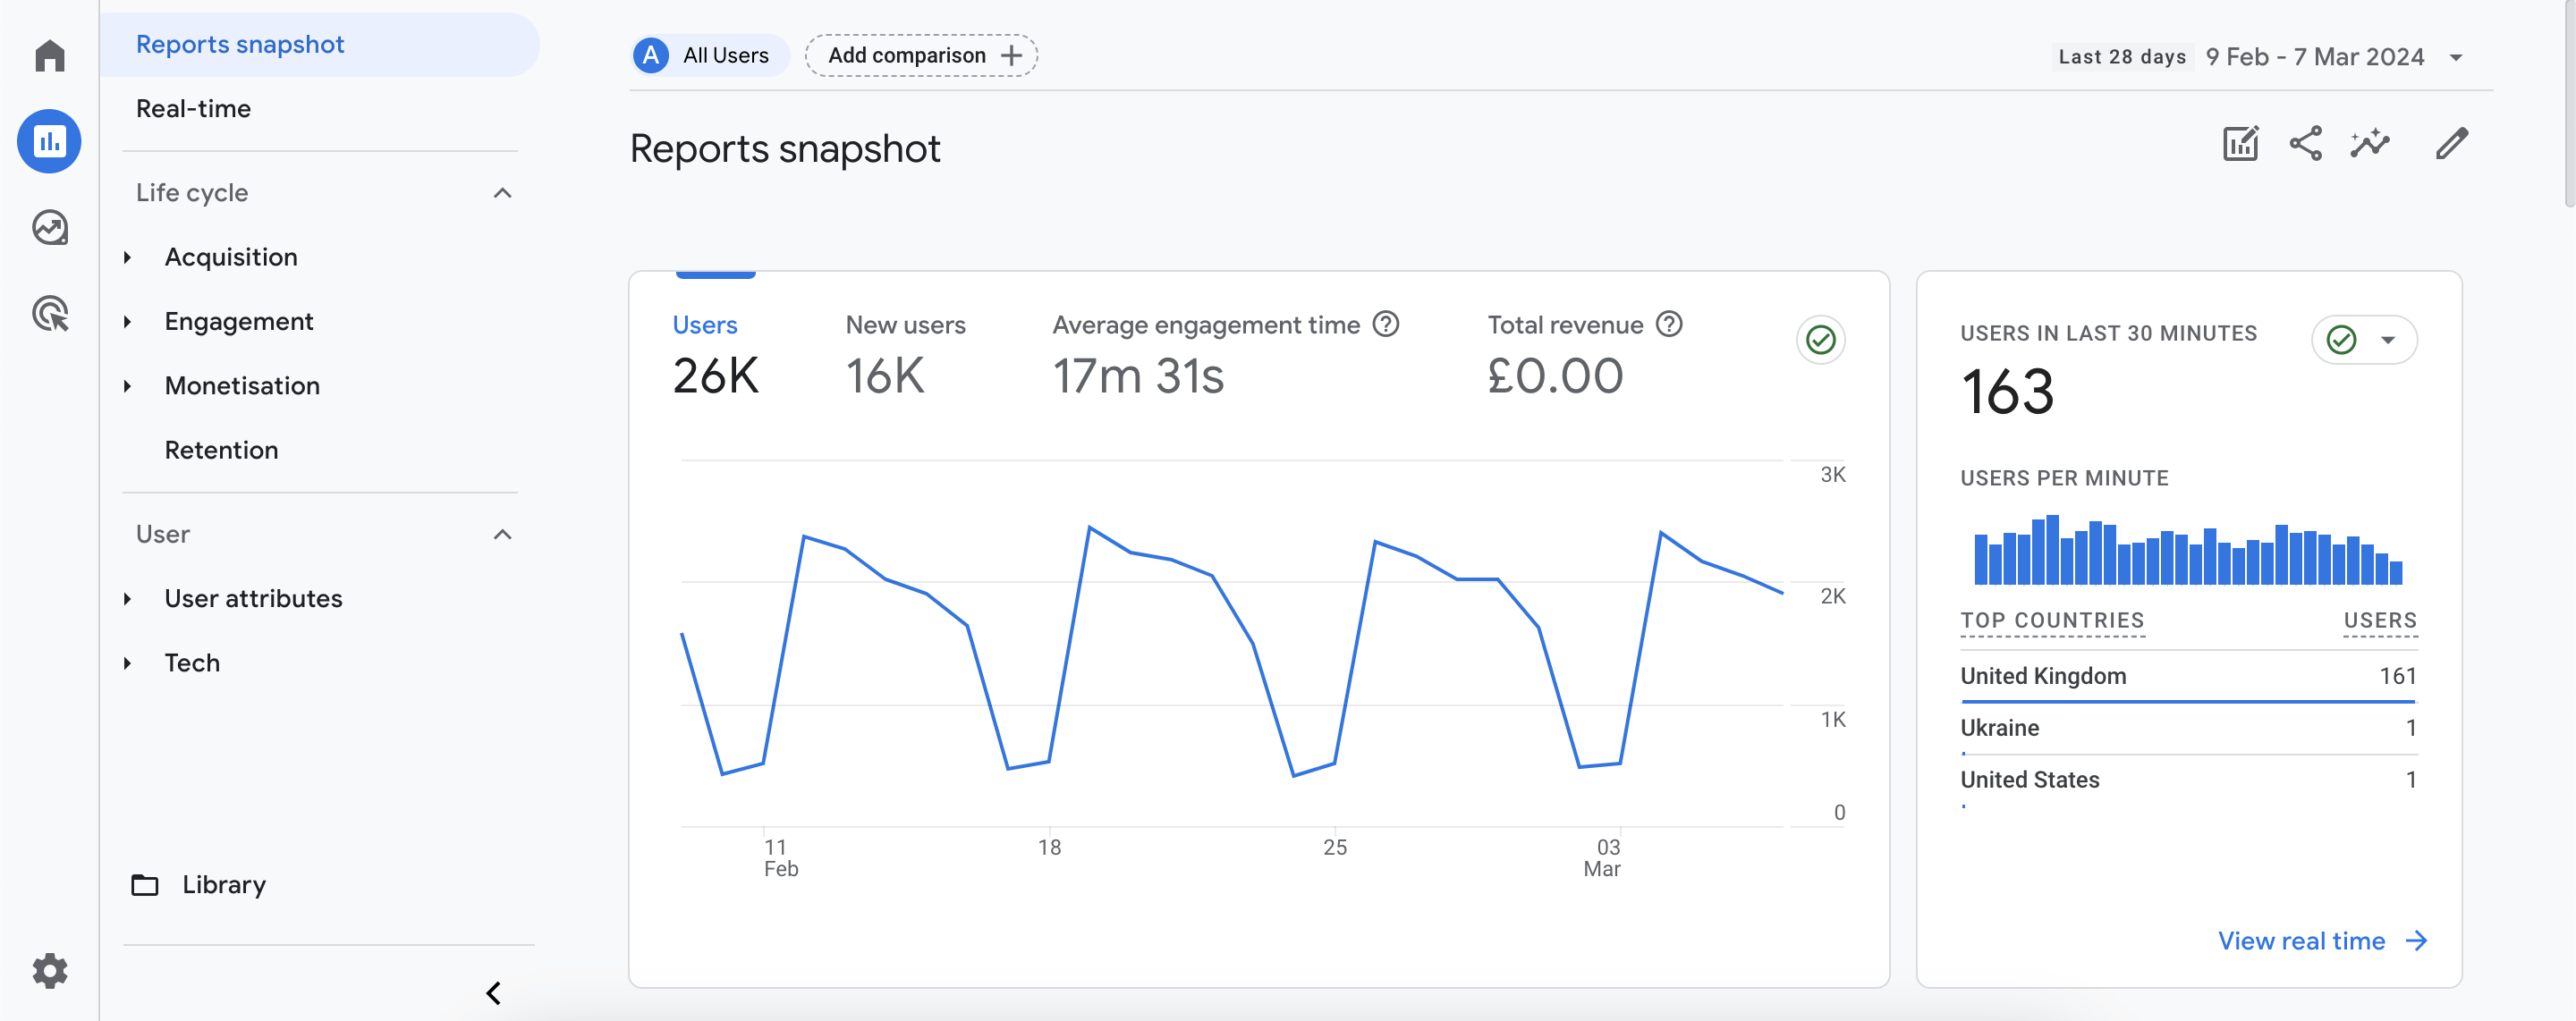
At first, navigating Google Analytics can be confusing. But once you become familiar with the basics, it’s possible to get a wealth of information.
On the furthest left hand side, you find the main navigation menu. Here you can choose to explore the dashboard or build a custom report, if there’s something specific you’re looking for.
When you click into the dashboard, you’re given more options, which hold different types of insights.
Real-time: What’s going on with your traffic right now?
Acquisition: Where’s your traffic coming from – Google, direct, an email etc
Engagement: How people are interacting with your LMS – the pages they visit, where they land, how long the spend on site etc.
Monetisation: This dives into any conversion points you’ve created, in the traditional sense it’s talking about lead generation or ecommerce sales, but it’s possible to reframe this and set up conversion points such as course completions or other conversion points you may have.
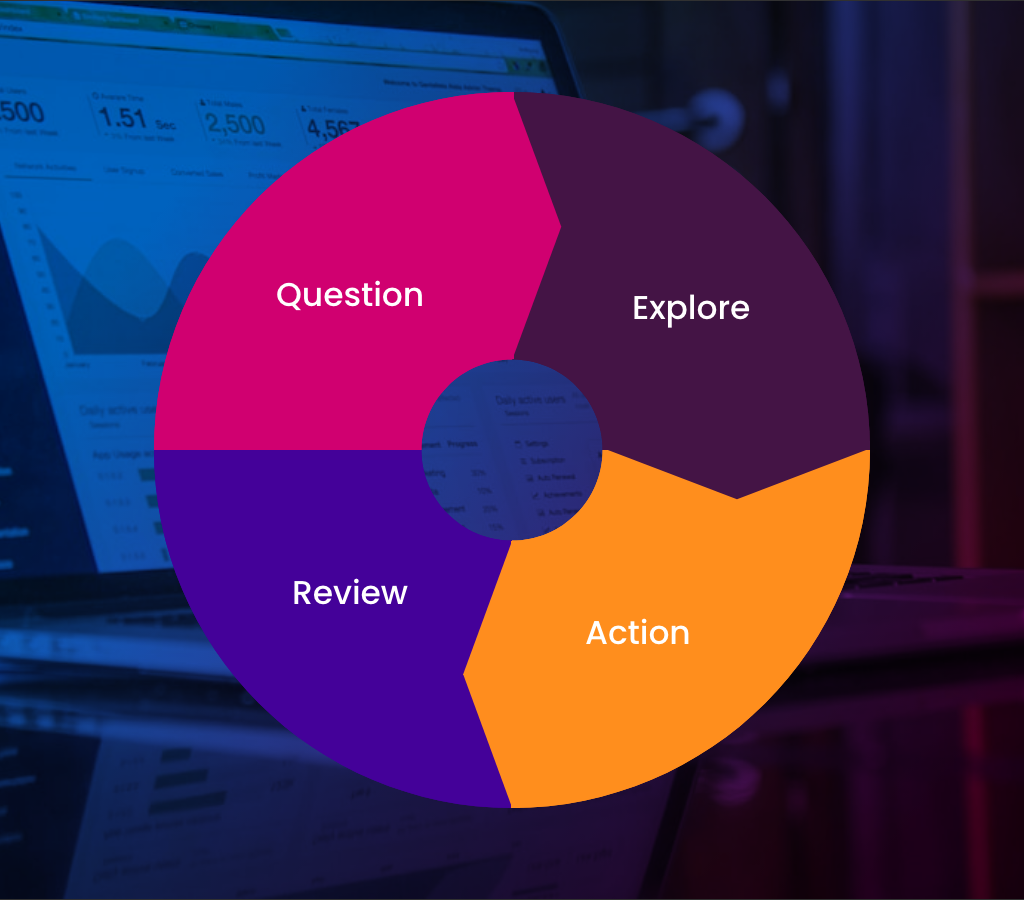
A quick process to help guide you through using data - what questions do you want to answer
There’s power in keeping it simple when it comes to data, after all we’re looking to complement our already busy workloads.
With a simple process that doesn’t take lengthy planning or hours of work you can gain useful insights.
Step 1: Start with a question or problem
Having a question that you want to answer from the get-go will frame the rest of your work and keep you focused.
Example
“How can I get more people to use the learning platform?”
Step 2: Explore different reports.
Insights are the stories and nuggets of information that will guide your future actions. When I start looking for insights, I start off with my objectives in mind and simply look through my different reports with an open mind, playing with filters and reporting fields until I find something useful.
The visualisations that Google Analytics provides make it easy to spot trends and anomalies, these are usually the types of events that I want to interrogate a bit further.
Once I identify an insight, I jot it down,
Example Insights:
Reviewing the sessions over time graph, I can see that the number of people coming to the platform has been declining slightly over the past three months.
There was a spike in traffic at the start of the month
Learners came to the platform most through an email newsletter we sent out.
I noticed that after lunch on a Wednesday is the busiest time.
Step 3: Take Action
Once you’ve got insights to hand, take what you’ve found and create a set of actions, designed to help move towards your goal.
Example:
Based on the insight that people naturally visit the LMS after lunch on Tuesdays and that we observe a spike in traffic after sending emails, we can formulate an action plan.
This month, we will schedule our email newsletters to be sent 10 minutes before the peak time on Tuesdays to capitalise on this trend. By doing so, we aim to increase the number of users accessing the platform during these periods.
Step 4: Review your results
Reviewing results is the next step after we’ve taken action – it’s where we see if our creativity has paid off. By reviewing the results of your experiments, you can see what was a hit and what was a miss.
When one of your experiments works as you expected, ask yourself whether you can commit it to process. Remember that it’s important to keep things fresh, and sometimes the impact of a particular activity will reduce, so keep being creative and trying new things when something gets stale.
Example:
After implementing the revised email scheduling strategy, we monitored the platform’s traffic patterns. The results were promising, with a noticeable 30% increase in platform usage during the targeted time slot.
This indicates that aligning our email distribution with peak user activity has positively impacted engagement. Moving forward, we will continue to analyse data and adjust our strategies to maintain momentum and adapt to changing user behaviours.
In Summary
Using LMS analytics doesn’t have to be an intimidating endeavour. By harnessing the power of tools like Google Analytics and following a structured approach to data analysis, you can unlock valuable insights that drive informed decision-making and propel your learning platform towards success.
Throughout this article, we’ve explored the importance of analytics in gauging platform performance, understanding user behaviour, and optimising engagement levels. From installing Google Analytics to interpreting data and implementing actionable strategies, each step is a building block towards a more data-driven approach to managing your LMS.
Remember, the key lies in collecting data and asking the right questions, exploring different reports, and continuously reviewing and refining your strategies based on insights gained. By adopting this iterative process, you can stay responsive to evolving user needs and ensure the long-term success of your learning ecosystem.
So, whether you’re a seasoned digital marketer or new to the world of analytics, I encourage you to embrace the journey of leveraging data to elevate your LMS. With curiosity, persistence, and a willingness to learn, you’ll find that working with data becomes not just a task, but a rewarding opportunity to drive meaningful impact and achieve your goals.


